News Release from American Clean Power Association (ACP)
Wind Industry Profile of
New report: Record Third Quarter for US Clean Energy Installations
The American Clean Power Association (ACP) today released the Clean Power Quarterly Market Report | Q3 2023, showing that the industry brought online 5,551 megawatts (MW) of utility-scale clean power capacity in the third quarter of 2023, enough to power 813,000 American homes. Third quarter installations increased 13% over the same period in 2022 and set a record for the strongest third quarter to date. Across the country, clean energy developers began commercial operations at 88 projects across 24 states.
The U.S. now has over 243 gigawatts (GW) of operating clean power, providing over 16% of U.S. electricity, enough electricity to power the equivalent of nearly 65 million homes.
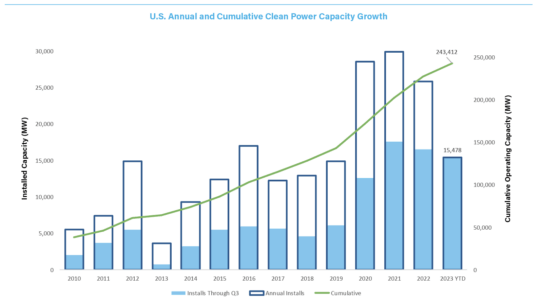
Image: ACP
“The demand for American clean energy is undeniable,” said ACP CEO Jason Grumet. “Even as we face a number of near-term challenges, these record-breaking numbers tell us that the U.S. clean energy sector continues to grow on a healthy, long-term trajectory.”
Grid-scale battery storage is being installed rapidly, having already exceeded total 2022 installations in just nine months. The industry connected 2,142 MW / 6,227 MWh of storage in the third quarter, bringing year-to-date installations to 4,374 MW / 13,444 MWh. Solar installed 3,121 MW in the quarter, outpacing the rate of installations in 2022 but slightly behind 2021 volumes. Just 288 MW of land-based wind capacity were commissioned in the third quarter, a 77% decline year-over-year. Year-to-date installations of solar, wind, and storage fell 6% as a slow first quarter and a sharp decrease in third quarter wind capacity additions contributed to the decline in year-to-date installation volumes.
Clean Power Pipeline: Projects Under Construction or in Advanced Development
While the full impacts of the Inflation Reduction Act (IRA) are yet to be determined, the IRA’s effect on the clean energy industry is evidenced by the growth in utility-scale project development pipeline. As of the end of Q3 2023, the project pipeline increased 10% year-over-year to 145,545 MW. There are currently 59,568 MW under construction and 85,977 MW in advanced development. The battery storage pipeline is strongest, having grown by an impressive 50% year-over-year, while the solar pipeline increased 8%.
Clean Power Procurement
Although quarterly installation levels surpassed 2022 levels in Q2 and Q3 of this year, power purchase agreement (PPA) announcements remain tepid amidst market headwinds. In the third quarter, 3.1 GW of PPAs were announced, a 55% drop from the same period in 2022.
Key Highlights | Q3 2023
- Installations: Developers began commercial operations at 88 projects across 24 states in Q3. The industry installed 5,551 MW of utility-scale clean energy in Q3, representing enough power for 813,000 American homes.
- Pipeline: Solar continues to dominate the project pipeline, accounting for 58% of clean power capacity currently under development. Battery storage and land-based wind each represent 15% of the pipeline, with offshore wind making up 12%.
- Sector Snapshot: Overall, solar led the quarter with 3,121 MW of installations, with battery and land-based wind following at 2,142 MW and 288 MW, respectively.
- Delays: Since the end of 2021, over 56 GW of clean power capacity has been delayed. This includes 16,639 MW of projects that were expected to come online during the first three quarters of 2023.
- Accounting for 67% of all delays, solar projects appear to be most impacted.
- On average, projects are delayed by 14 months.
- Power Purchase Agreements: Through Q3 of 2023, solar comprised 59% of all PPA announcements while land-based wind represented 32%.
- Compared to Q3 of 2022, solar PPA announcements for this quarter decreased by 59%, wind by 21%, and battery storage by 55%.
- Progress to Date: Across the U.S., cumulative operating clean power capacity now stands at over 243 GW, accounting for 16% of total electricity generation.
- California, a leader in clean energy, accounted for 1,900 MW (34% of clean power commissioned in Q3), while Texas and Arizona took the second and third spots, with 949 MW and 516 MW respectively.
- Cumulatively in 2023, California leads the nation with 3,031 MW installed, followed by Texas, which added 2,381 MW to the grid and Florida, which added 1,578 MW.
A scaled-down version of the report is available to the public, with ACP membership granting access to the full Clean Power Quarterly Market Report | Q3 2023.
- Source:
- ACP
- Author:
- Press Office
- Link:
- cleanpower.org/...
- Keywords:
- ACP, report, USA, installation, record, Q3, onshore, offshore, storage, battery, solar, commissions

