News Release from American Clean Power Association (ACP)
Wind Industry Profile of
Fact check: U.S. wind resources remain world-class
Wind speeds
It’s been well-documented that U.S. wind resources in 2015 performed below average, especially in the first half of the year. Much of the blame falls on the persistent El Nino weather pattern, which historically brings lower average wind speeds to much of the country.
The perception of lower wind speeds in 2015 was made more drastic in comparison to the abnormally high winds witnessed during 2014. Despite this slow start, 2015 finished with a record generation of 191 million megawatt hours (MWh) of wind energy, with a U.S. wind turbine fleet average capacity factor of 32.5 percent. That’s compared to 181.6 million MWh at a 34 percent capacity factor in 2014.
The resulting lower-than-average 5 percent annual growth in wind generation, while nevertheless impressive, does not suggest a new normal. Instead, as wind technology continues to improve and wind resources recover, wind generation will continue to grow at a faster clip.
Strong production in last half of 2015 and into 2016
Despite the relatively weak start to 2015, wind resources recovered well in the second half of the year. Analysis of monthly wind capacity factors provided by the Energy Information Administration (EIA) reveals that monthly capacity factors were higher for five of the last six months in the year compared to 2014.
Analyzing capacity factors – a measure of actual generation as a share of the theoretical maximum potential output — provides a method for comparing wind generation across years in which the installed capacity is not constant.
The latest data from EIA reveals healthy wind resources continuing in the first two months of 2016.
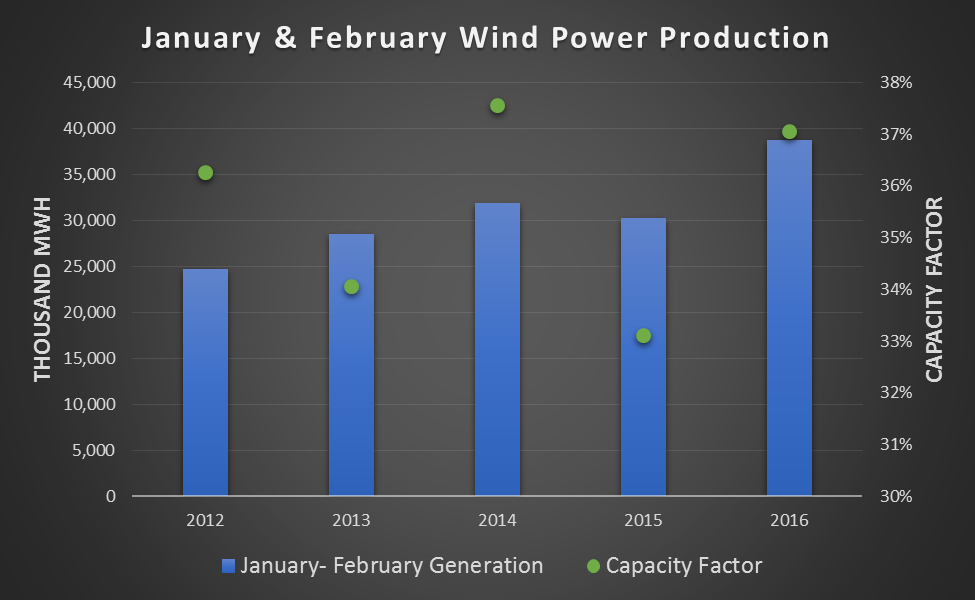
February of this year witnessed the most wind energy generation of any month in U.S. history, with wind turbines producing 20,214 gigawatts hours of electricity. More importantly, the chart below shows the wind fleet performing at similar capacity factors during the first two months as those experienced in 2012 and 2014, which were relatively strong wind resource years.

Wind production in the first two months of 2016
Resources as strong as ever
The overall higher level of wind energy production in January and February is partially a factor of the increased wind capacity installed across the U.S. Nevertheless, wind capacity factors for the first two months averaged 37 percent, just shy of the record winds in early 2014. The strong wind production in early 2016 is partially a reflection of wind speeds regressing to their long-term mean, but it also captures the increasing efficiency of today’s modern wind turbines.
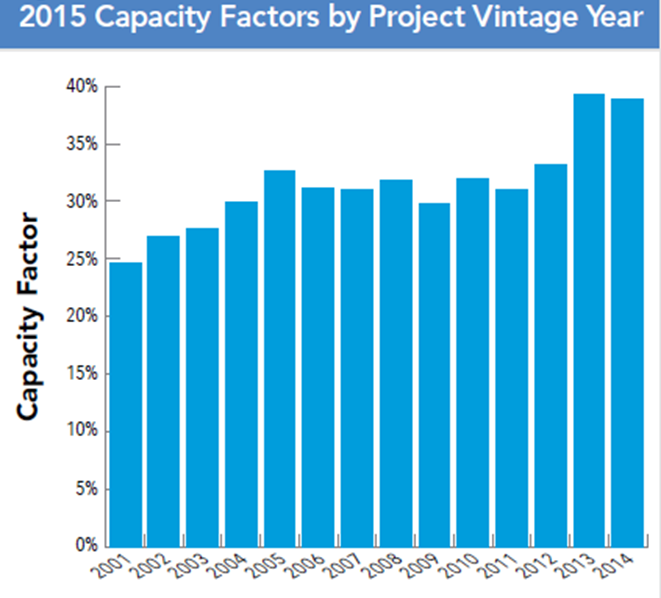
One way to investigate the efficiency and performance gains of wind turbines is to review capacity factors within a single year across wind turbine vintages – the year in which a wind turbine was commissioned. As the chart below shows, there have been two periods of significant performance gains, the first beginning with the 2004-2005 vintages and again with the 2013-2014 vintages. Wind turbines installed in 2013 and 2014 achieved capacity factors above 39 percent during 2015. And while 2015 wind turbines have not been operating long enough to make a determination, they are likely to have similar or higher performance rates.

Wind energy capacity factors
While it is true that wind energy generation only grew 5 percent from 2014 to 2015, it does not imply a concern that wind production is falling or that lower growth is the new normal.
Most of the lower growth rate in 2015 is attributable to the abnormally high wind resources in 2014 combined with lower average wind speeds in 2015. As wind speeds return to their long-run averages, wind generation is likely to grow significantly throughout 2016, especially as the 5,001 megawatts of new capacity installed in 2015 have more time to generate electricity.
Year over year growth rates are already trending significantly above the 5 percent experienced from 2014 to 2015. Rolling 12 month wind energy production through the end of February has grown 10 percent compared to the preceding period. Further, the first two months of the year have seen a 21 percent growth in wind generation compared to the first two months of 2014. All this despite earlier predictions that first quarter wind resources were expected to be below average in many areas with large wind turbine installations.
The strong wind generation in early 2016 is an important leading indicator of wind resource levels and wind turbine performance, but it’s important to keep in mind that it is just one data point.
As we’ve noted in earlier posts, wind power projects are designed to operate for decades, and like many other energy sources inter-annual variability in output is expected by investors and grid operators.
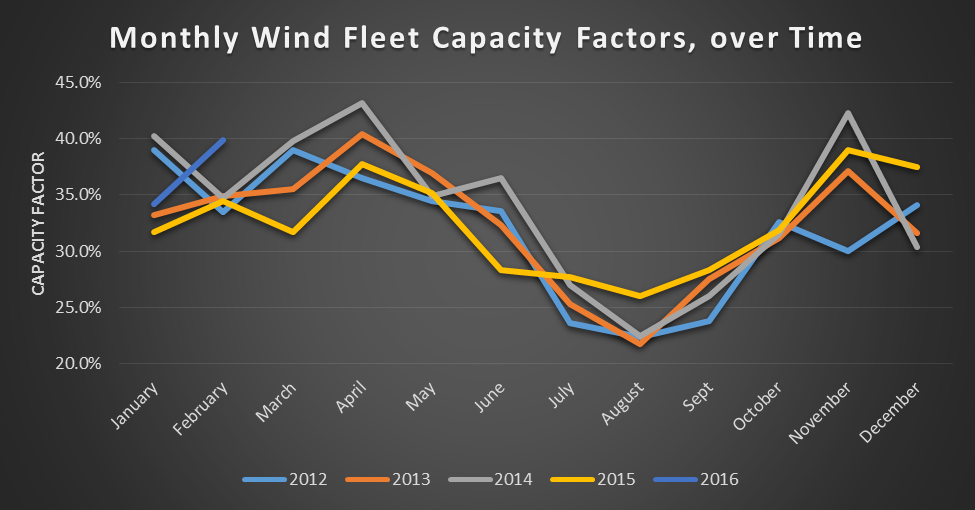
This final chart shows monthly wind fleet capacity factors for years 2012-2016, revealing relatively consistent monthly capacity factors from year to year. As wind turbine technology continues to advance, we will likely see continuing increases in productivity as they become ever-more efficient at harnessing clean, renewable wind power. This is an American success story we will be telling for years to come.

Wind capacity factors
- Source:
- AWEA - Into the WInd Blog
- Link:
- www.aweablog.org/...

