News Release from National Renewable Energy Laboratory
Wind Industry Profile of
NREL Finds Keeping Renewables at Today’s Levels—or Limiting Their Growth—Results in Higher U.S. Power System Costs
With declining costs for renewable energy technologies, interest has turned to how that might translate into the total system costs of integrating more renewable energy on the U.S. grid.
National Renewable Energy Laboratory (NREL) researchers Wesley Cole, Nathaniel Gates, and Trieu Mai examined how changing the contribution of renewable energy from the optimal solution impacts the cost of building and operating the electricity system, as well as trade-offs between emissions savings and system costs for higher and lower levels of renewable generation.
The results, outlined in an Electricity Journal article, point to a nonlinear relationship between system costs and renewable energy contribution: Small deviations from the least-cost solution have minimal cost impacts, while larger deviations from the least-cost solution can result in large cost changes. In addition, increased levels of renewables lead to lower absolute carbon dioxide (CO2) emissions.
"We found that we can get to 80+% renewable energy at the same cost as keeping the system at today's level of renewables," said Cole, NREL senior energy analyst and lead author of the paper. "Increased renewable energy contribution also reduces emissions, so going beyond today's levels of renewable energy is a no-brainer."
This work echoes the findings of another recent analysis published in Joule that showed the U.S. power system can achieve close to 100% renewable energy cost-effectively, but the last few percent come with a nonlinear cost increase. Here, Cole, Gates, and Mai did not study 100% renewable energy—but their results show that keeping renewables at today's levels or limiting their growth can also produce system cost increases.
Modeling the Least-Cost Solution Under Current Policies
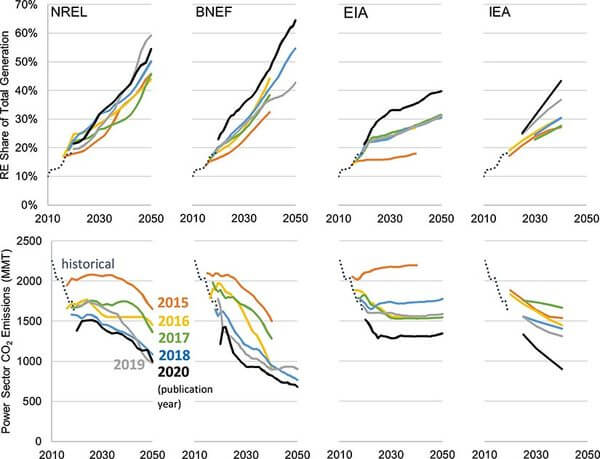
Several organizations publish long-term scenarios of the U.S. power sector on an annual basis—including NREL's Standard Scenarios, Bloomberg New Energy Finance's (BNEF's) New Energy Outlook, the Energy Information Administration's (EIA's) Annual Energy Outlook, and the International Energy Agency's (IEA's) World Energy Outlook.

Projected annual renewable energy (RE) generation share and power-sector CO2 emissions for the U.S. from NREL, BNEF, EIA, and IEA. The year the projection was made is shown by the color of the line. The dotted line shows historical values. MMT = million metric tons (Image: NREL).
"Across many of these scenarios, renewable energy deployment grows into the future as part of a least-cost electricity mix, assuming cost declines for renewable technologies as well as existing policies that incentivize renewable deployment," Mai said.
To examine how system costs change with different levels of renewable generation, the NREL team developed its own custom scenarios using NREL's Regional Energy Deployment System (ReEDS) model. ReEDS is a publicly available long-term planning model that simulates the evolution of the bulk power generation and transmission system for the contiguous United States from 2020 to 2050.
"Because ReEDS is a least-cost optimization model, it finds the solution that minimizes the annualized cost of the entire electricity system," Cole said. "Given a set of assumptions and the existing electricity system, ReEDS determines the least-cost mix of generators, storage, and transmission over time that meets system planning and operating requirements."
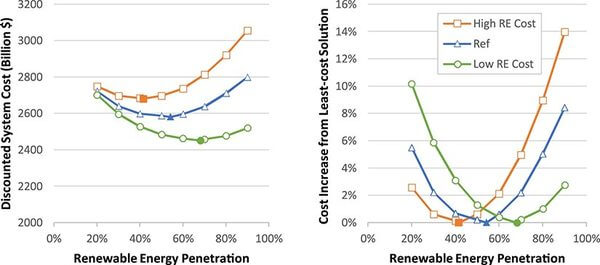
For this analysis, NREL used the same technology cost and performance assumptions from the 2020 Annual Technology Baseline that were used to produce NREL's 2020 Standard Scenarios. To create both consistent and feasible scenarios, the researchers removed state and regional policies like renewable portfolio standards. Based on the 2020 Standard Scenarios reference case, without those policy drivers, the "just right" (cost-optimal) solution was modeled to be 54% renewable energy generation in 2050.
"Requiring more or less than this fraction of renewables results in an increase to the cost of building and operating the electricity system, which we call the system cost," Cole said.
This applies under alternate conditions, as well. For example, in scenarios that assume higher-than-reference-case renewable energy costs, the least-cost mix for the United States has 42% renewables, and in scenarios with lower renewable cost assumptions, the least-cost mix has 68% renewables.
The Nonlinear Cost Impacts of Diverging From Optimal Renewable Energy Levels
To understand how system costs change with different levels of renewable deployment, NREL ran additional scenarios that constrained the ReEDS model to reach different national renewable generation levels ranging from 20% to 90%.

System cost as a function of renewable energy (RE) contribution in 2050 for high, reference, and low RE costs, using a 5% discount rate. The solid points show the least-cost solution. Note that the y-axis in the left plot does not begin at zero (Image: NREL).
The results from the analysis show that the relationship between system costs and renewable energy deployment is nonlinear.
"Small increases or decreases have a relatively small impact on system cost, while large increases result in large changes—and these nonlinear increases occur when you decrease renewables below the optimal level, as well as above it." Mai said. "In other words, there's a cost of not integrating renewables as much as the optimal level."
For example, using the reference-case renewable energy costs, enforcing 50% renewable generation in 2050 increases system cost by only 0.2% relative to the optimal solution with 54% renewables, but limiting the system to 20% renewables increases cost by 5.5%
Because of the nonlinear shape of the curve, the cost of enforcing a specific renewable deployment level is highly dependent on the assumptions used to produce the optimal solution.
For example, with low renewable cost assumptions, the system cost increase for reaching 90% renewables is 2.8% because renewable generation needs to increase 22 percentage points from the optimal solution (from 68% to 90%). But under high renewable energy costs, reaching 90% renewables increases system cost by 14% because renewable deployment needs to increase by 48 percentage points (from 42% to 90%).
It is important to note that renewable energy costs are also driven by the learning curve, or the experience curve that relates the cost of a renewable technology to its cumulative installed capacity or electricity generated. The authors did not model learning curve effects where greater renewable deployment can accelerate cost reductions.
What This Means for the Future Power System—and CO2 Emissions
"Ultimately, our findings suggest it is possible to get 80+% renewable energy in the power sector for modest additional costs, with significant benefits to climate, public health, and more," Cole said.
And with aggressive decarbonization goals driving much of the current conversation around renewable deployment, it is critical to also look at how different renewable energy deployment scenarios correspond with CO2 emissions reductions.
Given that emissions reductions are an associated benefit of increased renewable deployment, the value of the emissions reductions can be compared to the cost of achieving those reductions. In order to make that comparison, NREL translated the system cost and CO2 emissions over the full modeling timeframe into a levelized CO2 abatement cost.
The levelized CO2 abatement cost for lower-than-optimal renewable deployment is always negative. This is because system costs decrease as CO2 emissions decline for these solutions.
"Unlike system costs, CO2 emissions reductions are correlated to the extent of renewable energy deployment," Mai said. "In other words, you get benefits from lower system costs and emissions reductions from increasing renewable deployment from these sub-optimal levels."
Notably, this analysis does not consider the costs of externalities—damages from climate change, air pollution impacts, jobs and economic development, or other social impacts—that might also affect the optimal amount of renewable deployment. Future research should revisit the optimal (and near-optimal) amount of renewable deployment, given expectations for renewable technology improvements and whether we need to internalize these other effects when planning the system.
Learn more about NREL's energy analysis research.
- Source:
- NREL
- Author:
- Press Office
- Link:
- www.nrel.gov/...
- Keywords:
- NREL, renewable energy, costs, energy system, USA, decline, growth, integrating, grid, transmission grid, wind, solar


