New report finds attractive wind energy prices, at under 2¢/kWh on average
We are pleased to announce the release of the U.S. Department of Energy (DOE)’s “2018 Wind Technologies Market Report,” which provides an annual overview of trends in the U.S. wind power market. Highlights of this year’s report include:
Wind power capacity additions continued at a robust pace in 2018:
$11 billion was invested in new wind power plants in 2018. In 2018, wind energy contributed 6.5% of the nation’s electricity supply, more than 10% of total electricity generation in fourteen states, and more than 30% in three of those states—Kansas, Iowa, and Oklahoma. 232 gigawatts of wind are seeking transmission interconnection, 2% of which represents proposed wind plants paired with storage.
Bigger turbines are enhancing wind project performance:
Increased blade lengths have dramatically increased wind project capacity factors, one measure of project performance, and taller towers are on the horizon. The average 2018 capacity factor among projects built from 2014 through 2017 was 42%, compared to an average of 31% among projects built from 2004 to 2011 and 24% among projects built from 1998 to 2001.
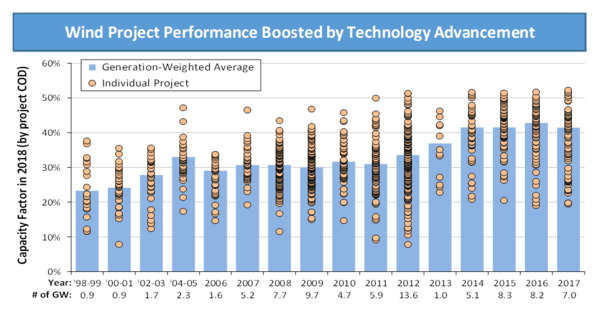
Wind Project Performance (Image: DOE / Berkeley Lab)
Low wind turbine pricing continues to push down installed project costs:
Wind turbine prices have fallen to $700–$900/kW. The average installed cost of wind projects in 2018 was $1,470/kW, down 40 percent since the peak in 2009 and 2010.
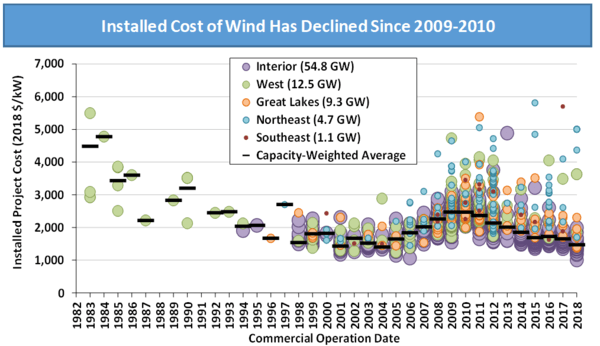
Installed Costs of Wind Energy (Image: DOE / Berkeley Lab)
Wind energy prices are at historical lows:
After topping out at 7¢/kWh for power purchase agreements (PPAs) executed in 2009, the national average price of wind PPAs has dropped to below 2¢/kWh—though this nationwide average is dominated by projects that hail from the lowest-priced Interior region of the country. These prices, which are possible in part due to federal tax support, compare favorably to the projected future fuel costs of gas-fired generation. Solar PPA prices have declined precipitously, pressuring wind’s competitive position.
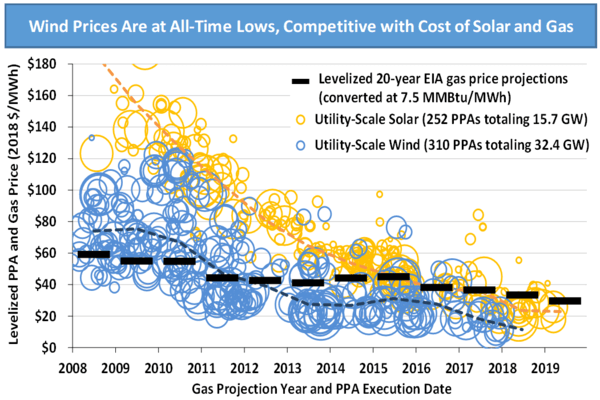
All-time low for wind costs (Image: DOE / Berkeley Lab)
The grid-system value of wind has declined over the last decade, but rebounded over the last two years.
The value of wind in wholesale power markets is impacted by the location of wind plants, their hourly output profiles, and how those characteristics correlate with real-time electricity prices and capacity markets. The market value of wind in 2018 was the lowest in the Southwest Power Pool and Texas (average of $17/MWh and $18/MWh, respectively) whereas the highest-value market was New England (at $41/MWh). Wind energy prices are generally competitive with these value estimates.
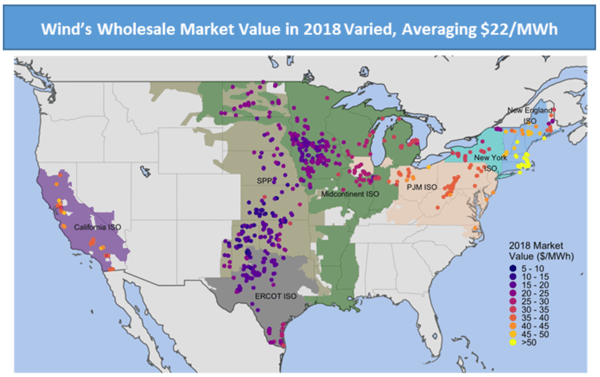
Wind's Wholesale Market Value (Image: DOE / Berkeley Lab)
The domestic supply chain for wind equipment is diverse:
For wind projects recently installed in the U.S., domestically manufactured content is highest for nacelle assembly (>90%), towers (75-90%), and blades and hubs (50-70%), but is much lower (<20%) for most components internal to the nacelle. Wind sector employment reached a new high of more than 114,000 full-time workers at the end of 2018.
Continued strong growth in wind capacity is anticipated in the near term:
With federal tax incentives still available, various forecasts for the domestic market show expected wind power capacity additions of 9,000-12,000 MW in 2019 and 11,000-15,000 in 2020, with market contraction anticipated beginning in 2021 as those tax incentives are phased out.
The report, a summary slide deck, several data visualizations, and an Excel workbook that contains much of the data presented in the report, can all be downloaded from: windreport.lbl.gov
- Source:
- Berkeley Lab
- Author:
- Press Office
- Link:
- emp.lbl.gov/...
- Keywords:
- Berkeley Lab, report, wind energy, prices, costs, USA, technology, turbine, performance, installation
Related News